Backtest Performance
Please note:
- Unless otherwise indicated; all prices, returns & model calculations use the closing auction price. The foreward test and paper trading pages only use data up to 4pm (before the closing auction).
- Closing prices are adjusted for capital actions and dividents.
- This site is updated every day, so prices may change due to adjustments but relative returns will not.
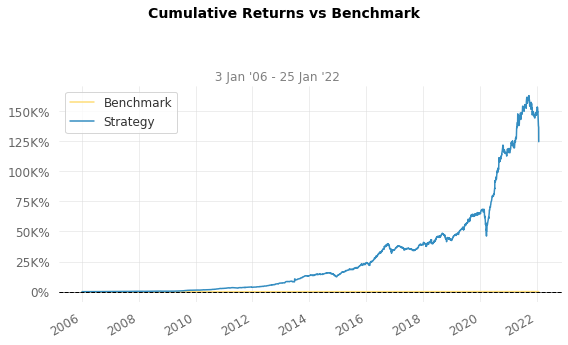
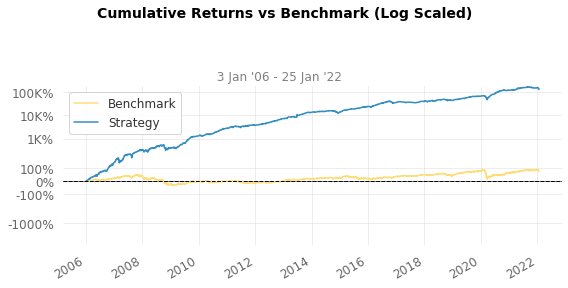
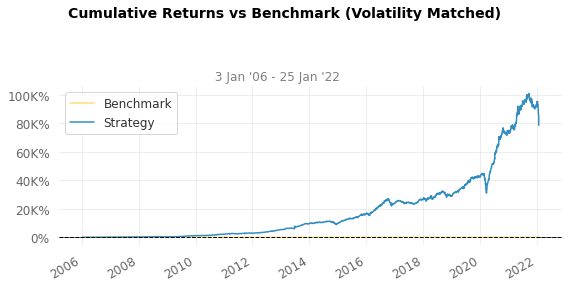
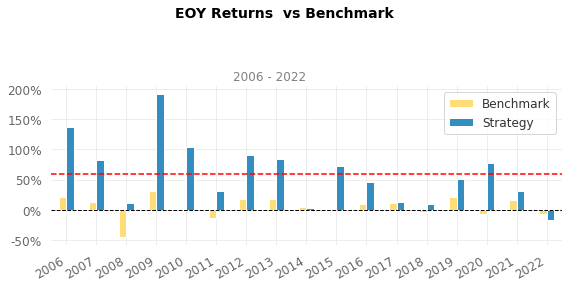
Model vs S&P/ASX 200 Total Return Index (XJOA) Summary
Strategy Benchmark
------------------------- ----------- -----------
Start Period 2006-01-03 2006-01-03
End Period 2022-01-25 2022-01-25
Risk-Free Rate 0.0% 0.0%
Time in Market 91.0% 100.0%
Cumulative Return 124,556.73% 72.77%
CAGR﹪ 55.82% 3.46%
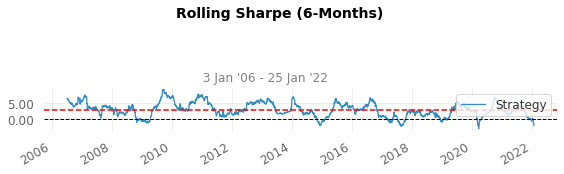
Sharpe 2.42 0.28
Smart Sharpe 2.13 0.25
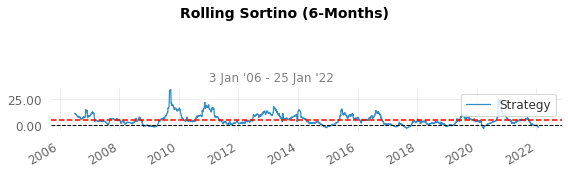
Sortino 3.88 0.38
Smart Sortino 3.42 0.33
Sortino/√2 2.74 0.27
Smart Sortino/√2 2.42 0.24
Omega 1.71 1.71
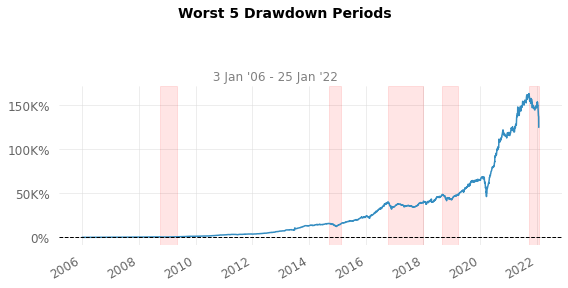
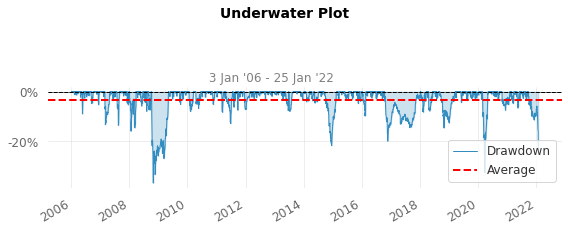
Max Drawdown -36.76% -56.88%
Longest DD Days 455 3700
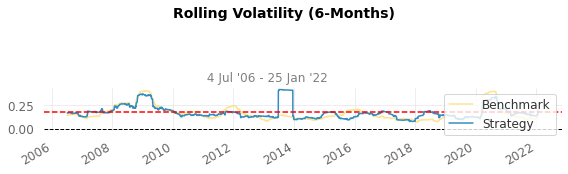
Volatility (ann.) 19.03% 17.75%
R^2 0.05 0.05
Calmar 1.52 0.06
Skew 2.71 -0.84
Kurtosis 79.8 8.24
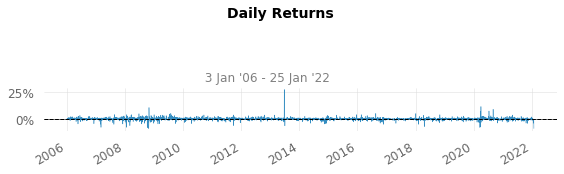
Expected Daily % 0.18% 0.01%
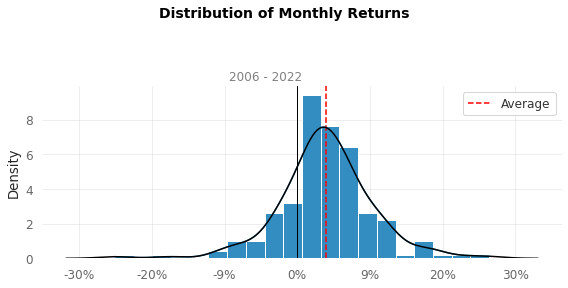
Expected Monthly % 3.76% 0.28%
Expected Yearly % 52.09% 3.27%
Kelly Criterion 26.66% -6.33%
Risk of Ruin 0.0% 0.0%
Daily Value-at-Risk -1.79% -1.82%
Expected Shortfall (cVaR) -1.79% -1.82%
Gain/Pain Ratio 0.71 0.05
Gain/Pain (1M) 4.1 0.3
Payoff Ratio 0.99 0.77
Profit Factor 1.71 1.05
Common Sense Ratio 2.17 0.97
CPC Index 1.07 0.44
Tail Ratio 1.27 0.92
Outlier Win Ratio 4.66 4.12
Outlier Loss Ratio 4.27 4.09
MTD -17.49% -6.76%
3M -19.35% -6.06%
6M -18.15% -4.74%
YTD -17.49% -6.76%
1Y 5.41% 4.61%
3Y (ann.) 39.28% 5.2%
5Y (ann.) 27.41% 5.26%
10Y (ann.) 41.23% 6.93%
All-time (ann.) 55.82% 3.46%
Best Day 27.75% 6.55%
Worst Day -8.87% -10.74%
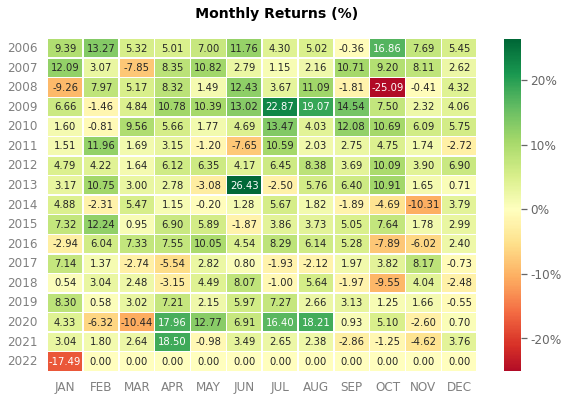
Best Month 26.43% 10.0%
Worst Month -25.09% -24.9%
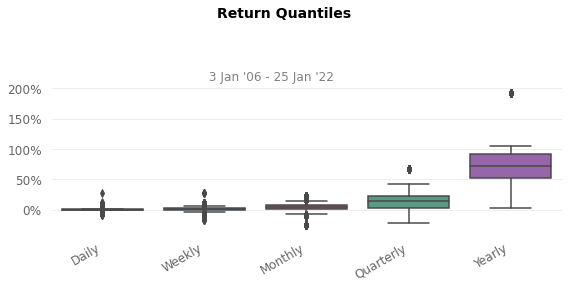
Best Year 192.13% 31.04%
Worst Year -17.49% -45.36%
Avg. Drawdown -1.96% -2.77%
Avg. Drawdown Days 13 67
Recovery Factor 3388.46 1.28
Ulcer Index 0.06 0.24
Serenity Index 1869.4 0.08
Avg. Up Month 6.97% 2.9%
Avg. Down Month -5.48% -5.48%
Win Days % 63.57% 53.66%
Win Month % 78.76% 62.18%
Win Quarter % 84.62% 66.15%
Win Year % 94.12% 58.82%
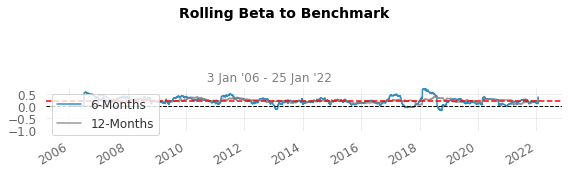
Beta 0.24 -
Alpha 0.45 -
Current Holdings
Currently holding 10 positions for an average of 12.3 days with a total portfolio return of -8.97%.
| Ticker | Buy Date | Current Date | Days Held | Buy Price | Current Price | Return (Total) |
|---|---|---|---|---|---|---|
| LOV | 2022-01-24 | 2022-01-25 | 1 | 17.1 | 17.15 | + 0.29% |
| BRN | 2022-01-25 | 2022-01-25 | 0 | 1.43 | 1.43 | + 0.00% |
| JLG | 2022-01-17 | 2022-01-25 | 8 | 8.6 | 8 | - 6.98% |
| GNC | 2022-01-19 | 2022-01-25 | 6 | 7.83 | 7.13 | - 8.94% |
| JHG | 2022-01-19 | 2022-01-25 | 6 | 54.8 | 49.76 | - 9.20% |
| WTC | 2021-11-23 | 2022-01-25 | 63 | 53 | 48.04 | - 9.36% |
| GRR | 2022-01-19 | 2022-01-25 | 6 | 0.795 | 0.72 | - 9.43% |
| AEF | 2022-01-21 | 2022-01-25 | 4 | 9.95 | 8.86 | -10.95% |
| ASX | 2022-01-04 | 2022-01-25 | 21 | 92.22 | 81.71 | -11.40% |
| AVZ | 2022-01-17 | 2022-01-25 | 8 | 0.865 | 0.66 | -23.70% |
Unrealised Returns